

Estimated Read Time: 15 Minutes
THE PREMISE
Zodiacal Releasing is a Hellenistic technique that was revived and popularised in modern astrology in the 1990’s. Similarly to Jyotish’s Mahadashas, it divides up the life into a sequence of periods and sub-periods, with some additional significators of significant time periods such as the loosing of the bond, peak periods and culmination periods.
In this test, I will take the IPO chart for the first trade of Nvidia stock (January 22nd, 1999, 09:30 AM, New York) and analyse its ZR (Zodiacal Releasing) periods against its historical price action. Can we find consistently bullish periods, bearish periods, or other valuable patterns?
In this technique, we can release from the lot of spirit, or the lot of fortune. I will be releasing from the lot of fortune. Can it reveal anything about Nvidia?
THE METHOD
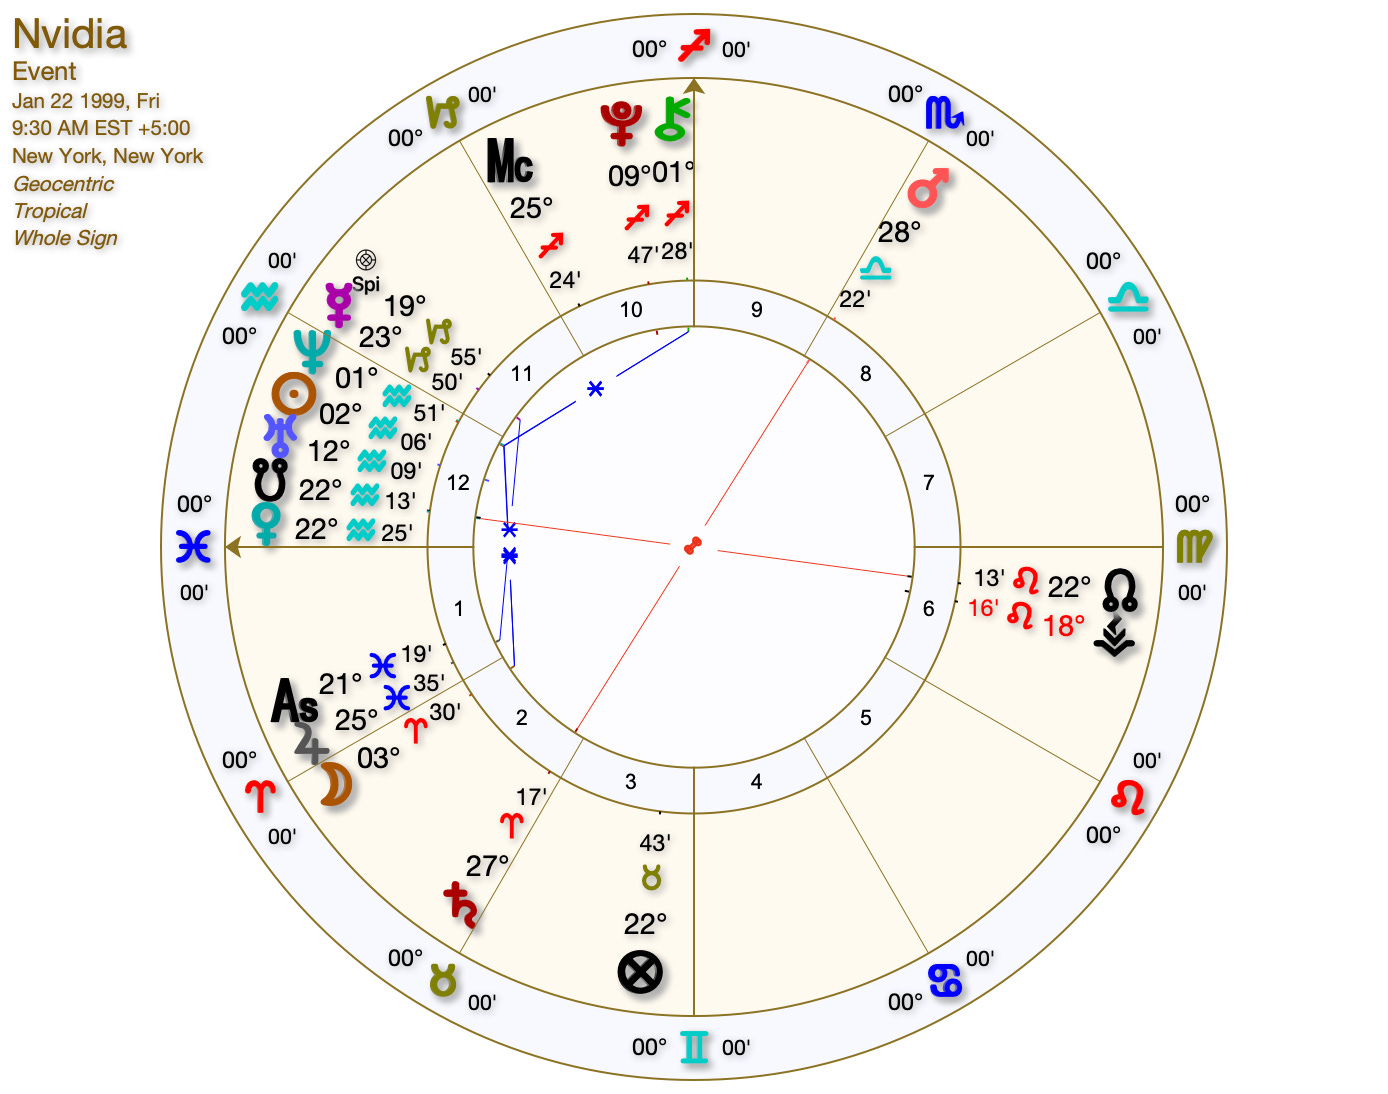
As you can see in this natal chart of Nvidia, the lot of fortune is at 22 Taurus, and the lot of spirit is at 19 degrees Capricorn. There are many softwares which can calculate zodiacal releasing periods. I am using Astrogold for Mac.
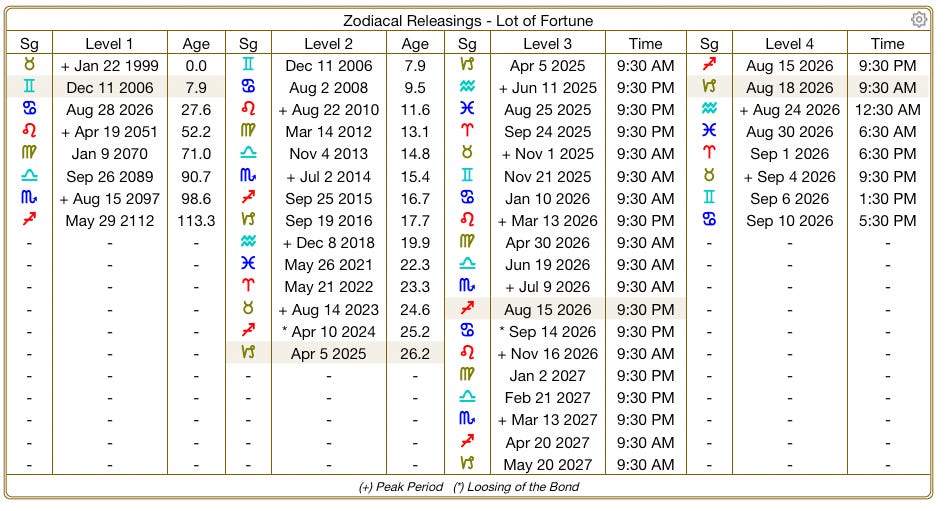
For the sake of ease, I will be testing Level 1, Level 2 and Level 3 ZR periods. I won’t include Level 4 ZR periods as they are only a few days apart and add a lot of noise to the data.
DATA INTEGRITY
Now we need daily price data for NVIDIA stock from its IPO on January 22nd 1999. One way of reliably doing this is using Google Sheets’ Google Finance Tool.
Try it yourself - open a new Google Sheet and paste this into cell A1:
=GOOGLEFINANCE("NASDAQ:NVDA","all",DATE(1999,1,22),TODAY(),"DAILY")It should return every trading day with date, open, close, high, low and volume. Hopefully you have something like this:

Nvidia has split its stock six times, so old share prices must be adjusted to match today’s share count. The data appears to have been adjusted correctly.
The main problem is that Nvidia’s early share prices were extremely low and recorded only to the nearest cent. Before 2016, tiny short-term price moves can be distorted or erased by rounding. That makes short Zodiacal Releasing periods unreliable for the early data.
So the analysis only uses short periods starting from 2016 onward, when the price data is precise enough. It is better to use fewer reliable examples than many inaccurate ones.
Also, Nvidia has grown very quickly over its whole history - about 36.6% per year. That means simply asking “did the stock go up?” is not useful, because it usually did. The important question is whether Nvidia performed better or worse than its normal long-term growth trend during particular Zodiacal Releasing periods.
Now we just need to choose a data processor of your choice to crunch the numbers. (I’ll be using Kimi K3 from Moonshot.)
27 years of data are covered, so we’re taking quite a lot into context.
KEY FINDINGS
Before we see the results, we need to understand de-trending.
The secular drift of Nvidia stock is about 36.6% per year. We want to find periods that report excess return - or the annualised period minus the stock’s own secular drift. Prices will also be adjusted for stock splits
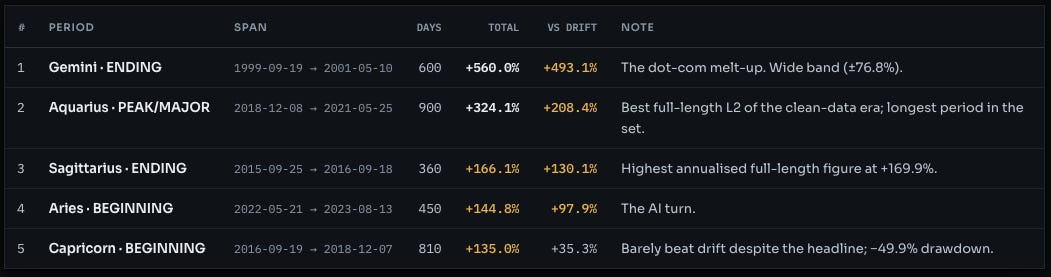
There are 20 Level 2 Periods Analysed. The 5 most bullish Level 2 periods as a whole are as follows:
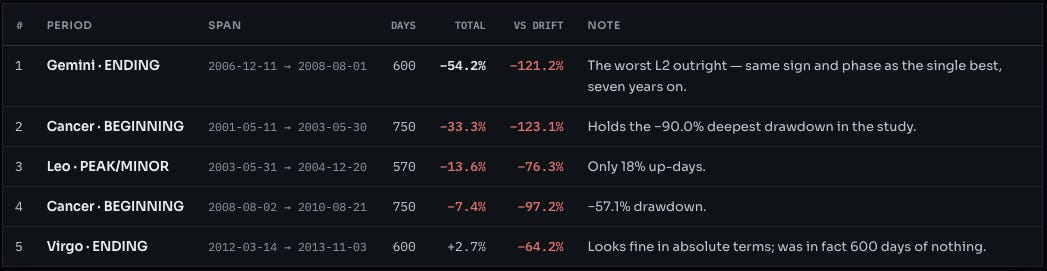
The 5 most bearish Level 2 periods as a whole are as follows:
For the much shorter Level 3 Periods, the top 5 most bullish periods were:
Capricorn 2023-05-11 (67d, +57.4%)
Capricorn 2025-04-05 (67d, +52.6%)
Capricorn 2016-09-19 (67d, +49.7%)
Gemini 2017-05-07 (50d, +48.1%)
Leo 2023-12-24 (48d, +47.7%).
Three of the top five most bullish periods are Capricorn periods.
The top 5 most bearish level 3 periods were:
Capricorn 2018-11-03 (35d, −31.3%)
Cancer 2025-02-14 (50d, −30.3%)
Leo 2021-12-12 (47d −27.4%)
Scorpio 2022-04-08 (38d,−26.8%)
Sagittarius 2018-10-04 (30d, −25.1%)
CANCER PERIODS
Both Cancer Level 2 periods were difficult. The 2001 to 2003 window drew down 90.0% peak to trough and finished down 33.3%. The 2008 to 2010 window drew down 57.1% and finished down 7.4%. They are the only two Level 2 periods in the sample with a negative return. Of course, this also perfectly aligns with the dot-com bubble burst and the 2008 crash. Any stock’s chart could look bearish in those windows.
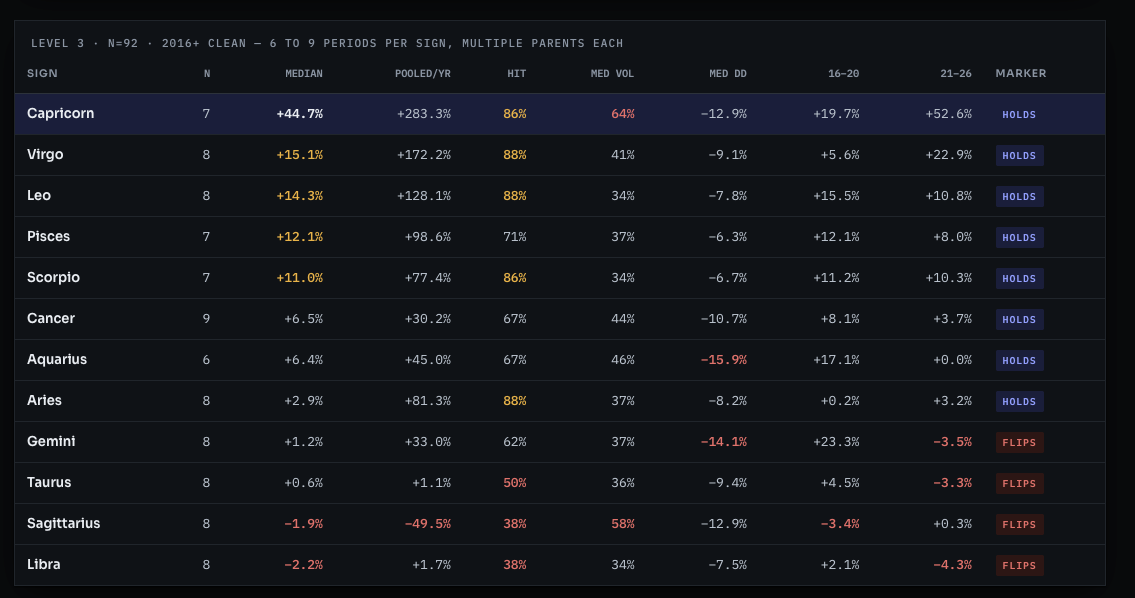
And at Level 3, where there are nineteen Cancer periods rather than two, the effect disappears - Cancer ranks fifth of twelve signs, with a median +3.7% and 58% of periods positive. Post 2016 it’s +6.5% and 67% positive.
ANGULARITY FROM FORTUNE
The four signs angular to Fortune - Taurus, Leo, Scorpio, Aquarius - returned a median +8.8%, against +4.5% cadent and +1.6% succedent, across the 92 precision-clean Level 3 periods since 2016.
SATURN PERIODS
In the clean post 2016 data, Saturn-ruled periods return a median +23.6% with a 77% win rate, the strongest of any ruler. Three of the five most bullish level 3 windows are Capricorn. The level 2 period closing this week is Capricorn, at +130%.
THE LOOSING OF THE BOND
The Level 2 loosing of the bond on April 10th 2024, was followed by a bullish AI expansion that topped on January 6th, 2025, exactly 8.9 months later. Nvidia then fell 36.9% into its April 2025 low.
This rhymes with what I found whilst experimenting with a chart I use for the Dow Jones chart - where all four Loosing of the Bond transitions (1936, 1956, 1980 and 1999) preceded a major cyclical top within two to ten months, but I don’t think there’s enough data to form any conclusions yet.
USING THE RELEASING PERIODS
On August 28th, 2026, Nvidia’s Level 1 Period changes from Gemini to Cancer.
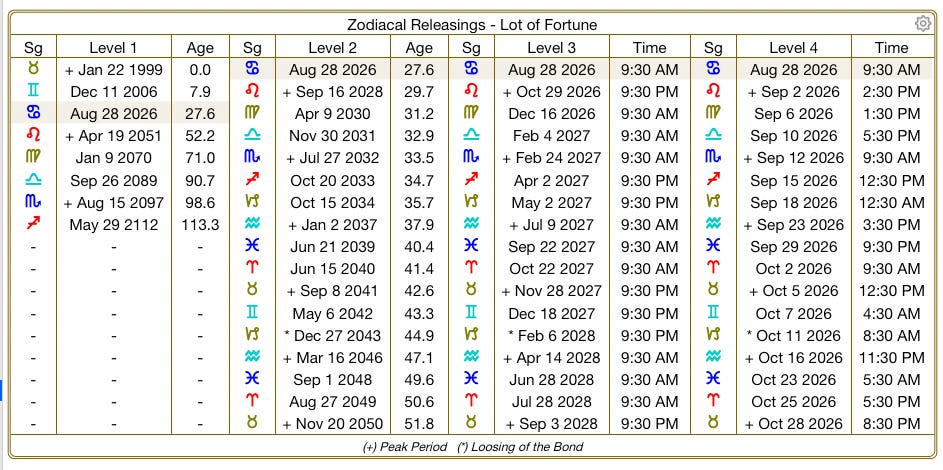
Level 1 and Level 2 Cancer period runs from August 28th, 2026 to September 16th, 2028. Remember - in our testing, Cancer periods were the most bearish.
Notice the Loosing of the bond period on February 6th 2028. This is the same type of marker that preceded the January 2025 top by nine months, and that preceded four consecutive Dow Jones cyclical tops in my experimental research.
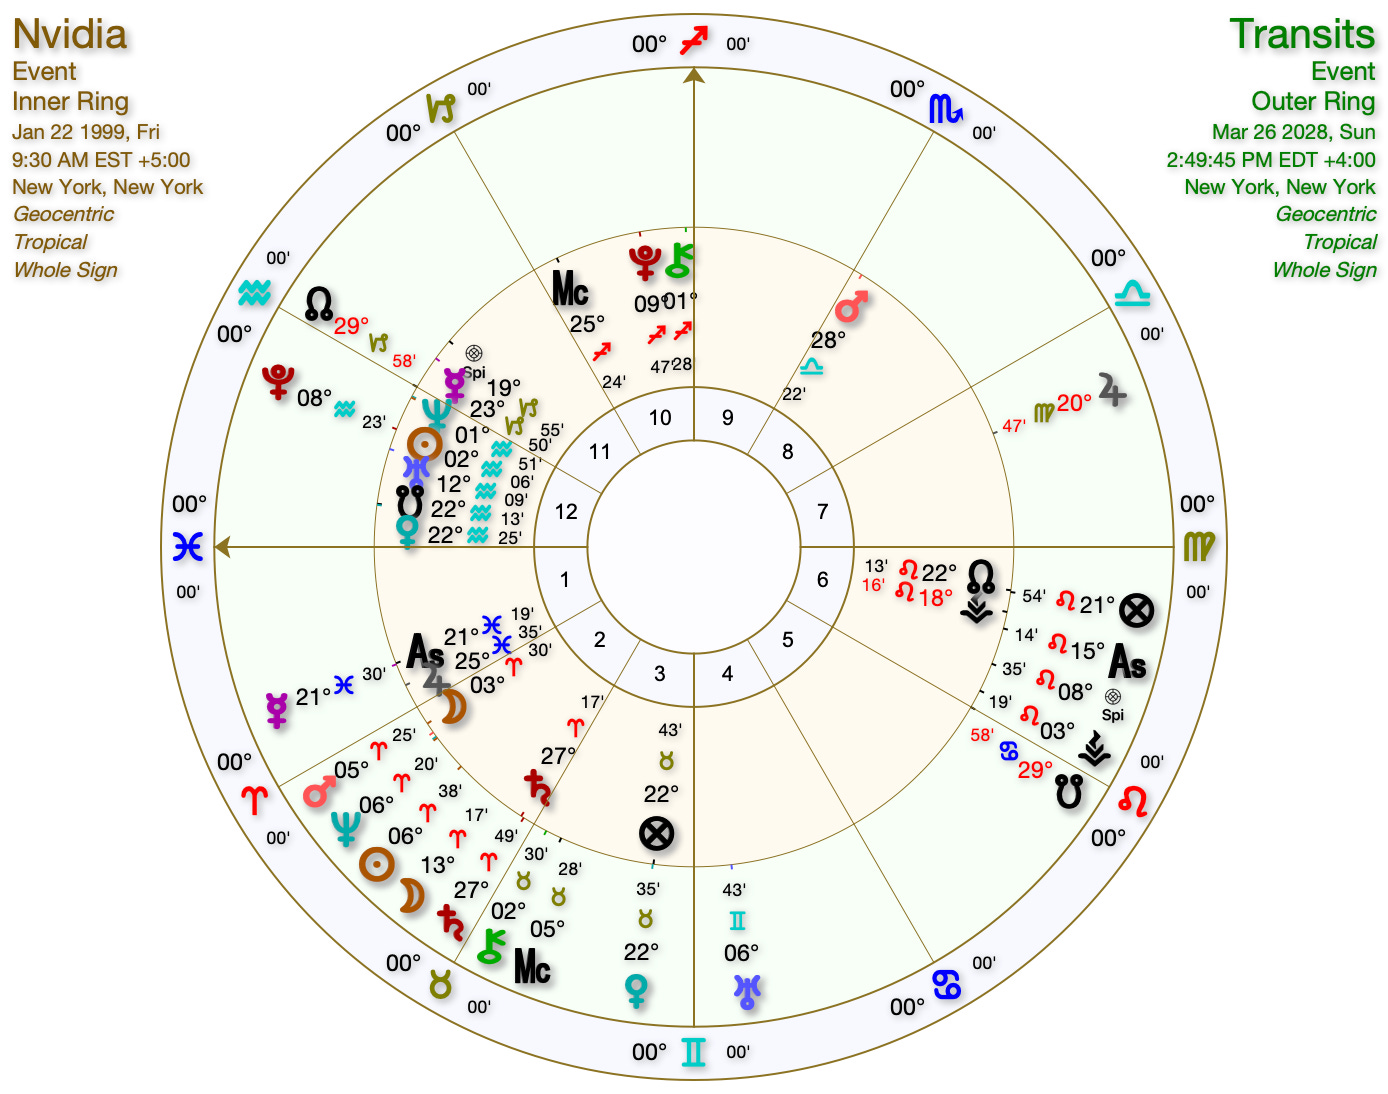
So, we could anticipate that the deepest drawdown of the Cancer period should begin within 60 days of the February 6th 2028 loosening of the bond - this could align with the Saturn Return in the Nvidia IPO chart, which occurs March 26th 2028. There is a tension here, with a Saturn return classically indicating contraction and restructuring - yet on this chart Saturn's zodiacal releasing periods have been the most bullish of any ruler, and both Level 3 periods running from February to June 2028 are Saturn ruled, so I'm watching to see which reading wins.
To conclude, I find zodiacal releasing to be a valuable technique to analyse a stock’s timing, although in future I’d like to test it on an asset which doesn’t have an insanely bullish annual drift. Things aren’t quite as clear but as I hoped when testing this technique. I will in future analyse Zodiacal Releasing with something more volatile such as Bitcoin.
This concludes this report on the Zodiacal Releasing of Nvidia. If you’d like to further support my work and gain insight into your own personal financial astrology and wealth timing, I offer a range of personal Financial Astrology services on my Store.
Om Shanti,
Rowan
Rowan’s Financial Astrology
Disclaimer: This is not financial advice. The author is not a financial advisor. This astrological analysis is for educational purposes only.
Cryptocurrency investments are highly risky and speculative. Always do your own research and consult qualified professionals before making investment decisions.
Astrology is an indicative model and does not claim causative effect. Users bear full responsibility for decisions based on this content, the author disclaims all liability. Astrological insights are interpretive with no assured outcomes.
try computing average daily return for each period rather then full period return. remember ZR periods have different lengths