
The 18.6 Year Cycle: How the Moon’s Nodes Predict The Impending Market Crash
The Great Depression. The 2008 collapse. A forgotten cyclical rhythm with origins in Pig Iron proves the global economy is headed for a 2027 reckoning.

Executive Summary:
This report explores the uncanny convergence between Lunar Nodal cycles and global economic phases. By synthesizing the 19th-century price prophecies of Samuel Benner, the financial astrology of Louise McWhirter, and modern property cycle theory, we identify a recurring 18.6-year rhythm that has predicted every major market pivot point for over a century.
The primary trend of the world economy follows the North Node’s transit through the Zodiac. We are currently exiting a “cooling” phase and accelerating toward a cyclical low last seen during 2008.
Key Dates:
October 2026: The North Node enters Aquarius and the current growth phase reaches its expiration date.
2027: The Year of the Stock Market Crash
2032: The Final Bottom
2035: The Roaring 30’s - A new era of prosperity mirroring the post-war boom of the 1960s.
⏱ A 20-Minute Read
18 YEARS OF GREED AND FEAR
Today we’re looking into an incredible confluence between astrological cycles and business cycles. This is the 18.6 year nodal cycle, also known as the McWhirter cycle or the Benner cycle.
You may have seen the following image before:
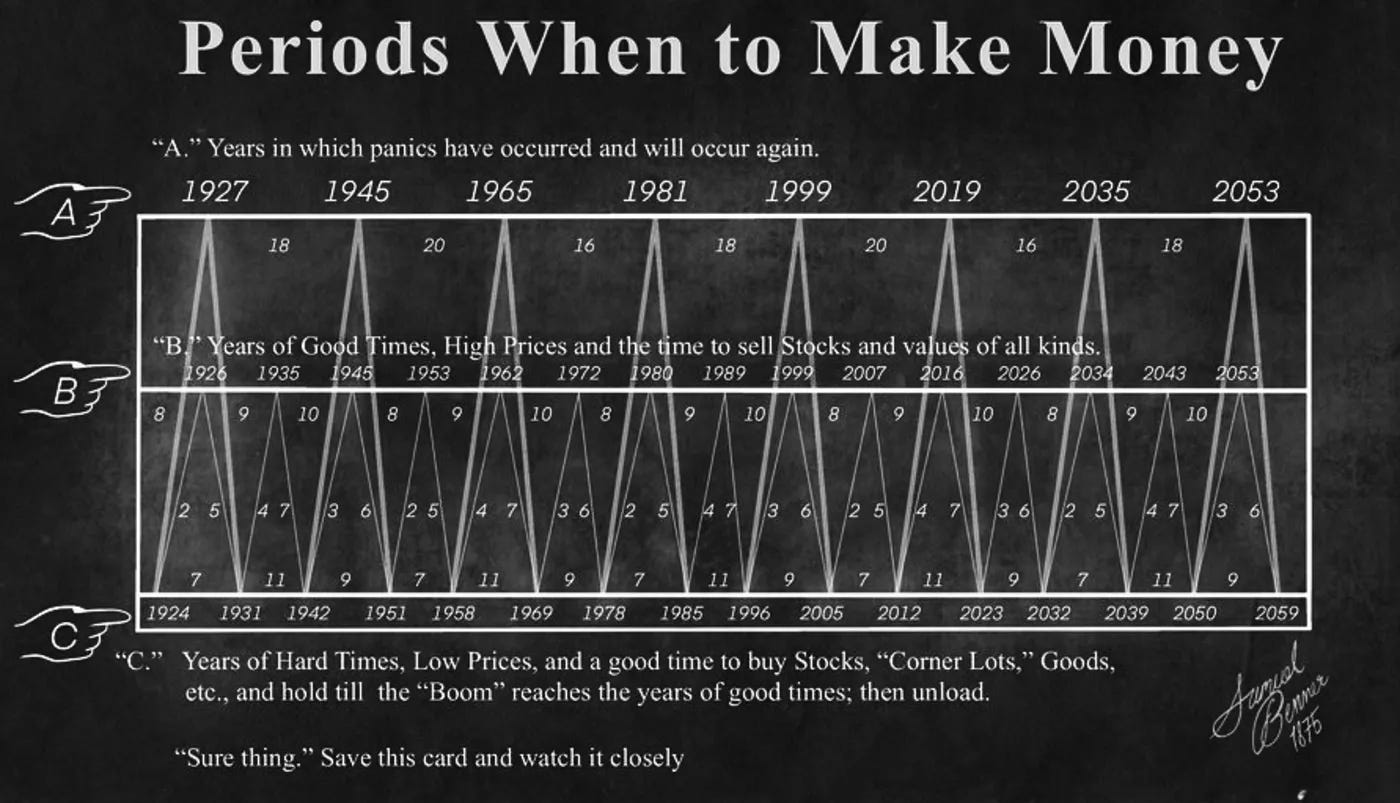
Benner was an Ohio farmer who had enough awareness to notice that pig iron and corn prices followed a rhythmic pattern. In 1875, he published his findings in a book titled “Benner's Prophecies of Future Ups and Downs in Prices: What Years to Make Money on Pig-Iron, Hogs, Corn, and Provisions.” You can still buy this book today.
The chart's fame exploded in the 1930s after it was "rediscovered" in 1902 and was later reprinted in the Wall Street Journal in 1933. It had accurately predicted the 1929 crash decades after Benner's death.
Take a look for a second at the chart.
Hand “C” is pointing to the low years of the cycle. We see the 1924 Weimar republic chaos, the 1929-1931 great depression, the 1942 war economy inflection, the 1958 post-war recession, the 1969-1970 economic slowdown post Vietnam war, the 2008 crash is on the way down from 2007 in this model, the 2020 crash was one year away from the indicated panic year of 2019, with the next bottom forming around 2032.
The chart is not perfect by any means, but does seem to get a general trend correct. It accurately called to sell stocks in 1926/1927, just before the October 1929 great depression crash. It accurately called to sell stocks in 1945 when we see economic setbacks showing up in 1946. It suggested to sell stocks in 1999, just before the dot-com bubble peak came in March 2000, after which the Nasdaq lost about 75% by late 2002. It accurately calls to sell stocks in 2007, just before 2008. And now, in agreement with my own thesis, it anticipates a downturn in 2026. I think after March or April it will become increasingly obvious that 2026 is a down-market year, with this being confirmed by August.
Benner suggested here not an 18 year cycle precisely but a cycle of 16 years, then 18, then 20, with this repeating every 54 years. He was one of the earliest examples to document how markets repeat in almost-predictable cycles.
ENTER THE FINANCIAL ASTROLOGER
In 1937, Louise Mcwhirter, a legendary figure in Financial Astrology, published the groundbreaking book “Astrology and Stock Market Forecasting”. Yes - Financial Astrology has been practiced since that time, and likely before this book came out.
In the book, she is believed to have made the first modern connection between the 18.6 year cycle of the lunar nodes directly to the price action of the NYSE. She formalized the “Nodes as an Economic Indicator” theory.
McWhirter argued that the primary trend of the market in the U.S. follows the 18.6-year revolution of the North Node through the 12 signs of the zodiac.
The idea is pretty simple:
